Northstar V3: Program Dashboard
Introduction
The program dashboard provides a centralized view of instructor-related activity and class performance. It enables instructors and administrators to quickly review student progress, attendance, and completion metrics based on selected filters. With built-in summary indicators and interactive data views, the dashboard support efficient monitoring of student performance and identification of at-risk learners.
Getting Started
To view instructor data, begin by entering the desired filter criteria:
- Program or Cluster
- Status
- Class Date
After entering the required criteria, select Load to display the results.
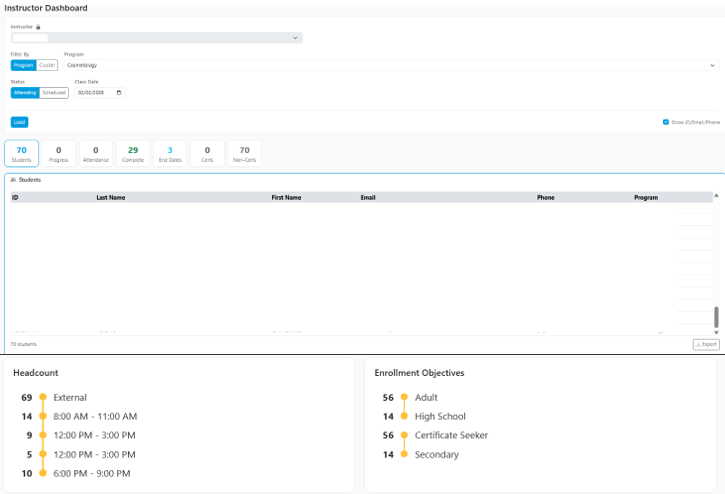
The results table will populate with student-level details, including student ID, contact information, and program enrollment, providing a clear view of class participation.
Dashboard Overview
The dashboard includes several summary tiles and supporting data visualizations that provide insights at a glance.
Key summary metrics include:
- Total number of students
- Student progress
- Attendance status
- Course completions
- Upcoming end dates
- Certifications and Non-certified learners
Additional visual elements, such as Headcount and Enrollment Objectives, provide deeper insights into class composition and performance trends.
Using Summary Tiles
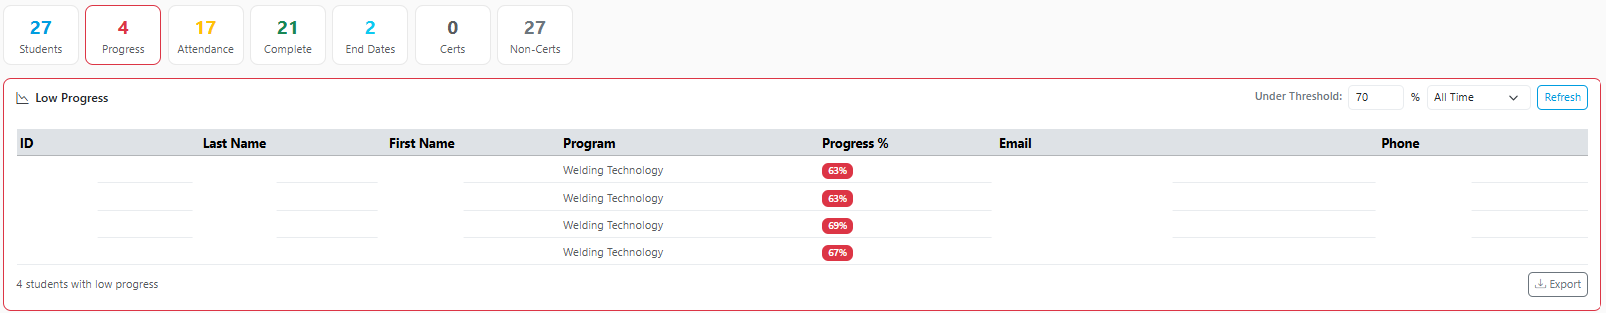
Each summary tile is interactive and allows you to filter the student list based on specific thresholds and timeframes.
When selecting a tile:
- Enter a threshold value (for example, progress below 70%).
- Choose a time range (such as last 30 days, current month, or previous month).
- Select Refresh to update the results.
Filtered results can also be exported to Excel for further analysis.
Progress
Displays students whose progress meets the selected threshold and timeframe. This is useful for identifying students who may be falling behind or progressing slowly.
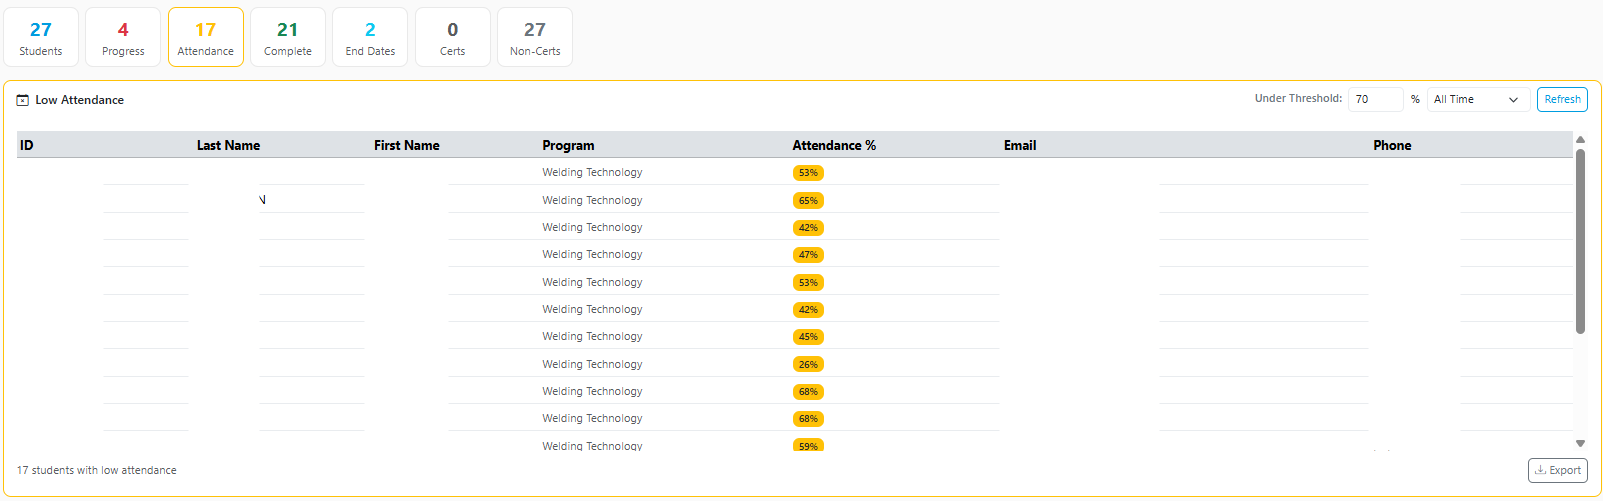
Attendance
Highlight students whose attendance falls below a specified percentage. This view helps identify students who may require additional support or follow-up.
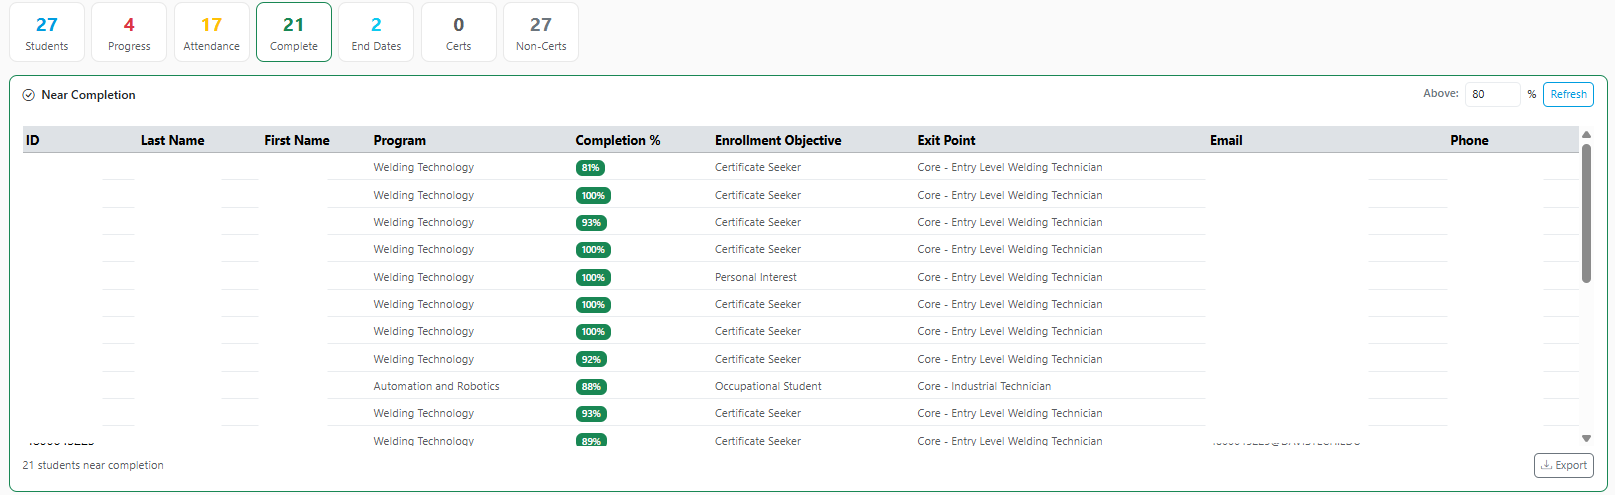
Complete
Displays students who meet or exceed a selected completion percentage (for example, students above 80% completion).
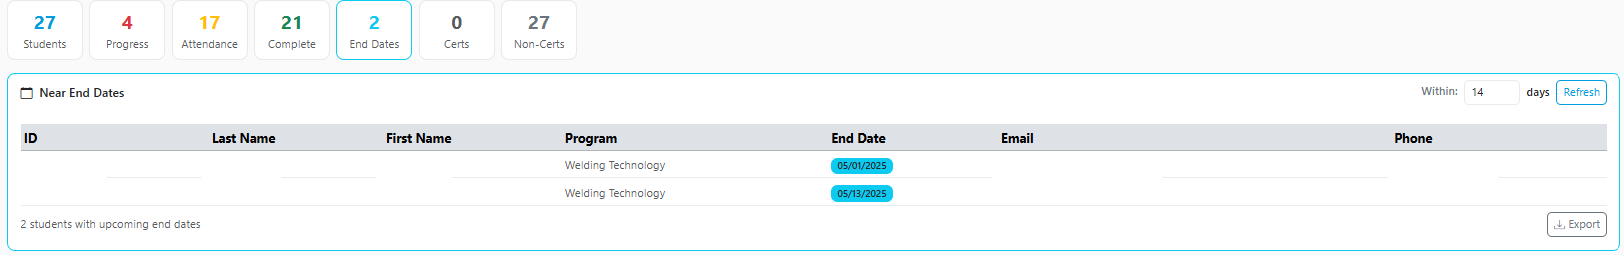
End Dates
Shows students whose program end dates fall within a specified number of days, helping instructors track upcoming completions.
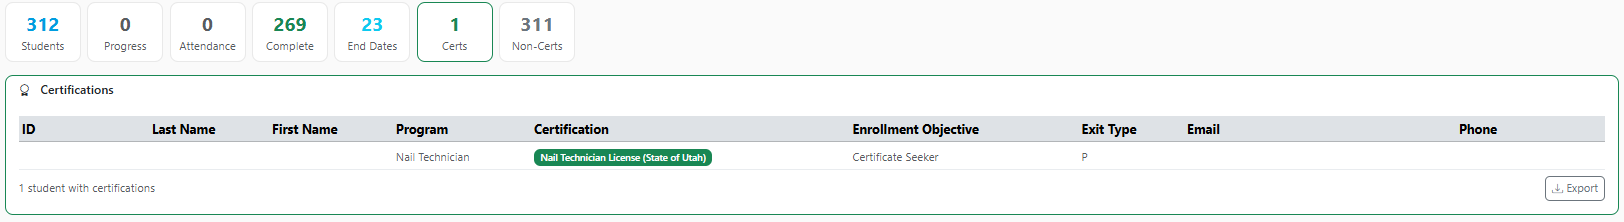
Certifications (Certs)
Displays the number of students who have successfully earned certifications.
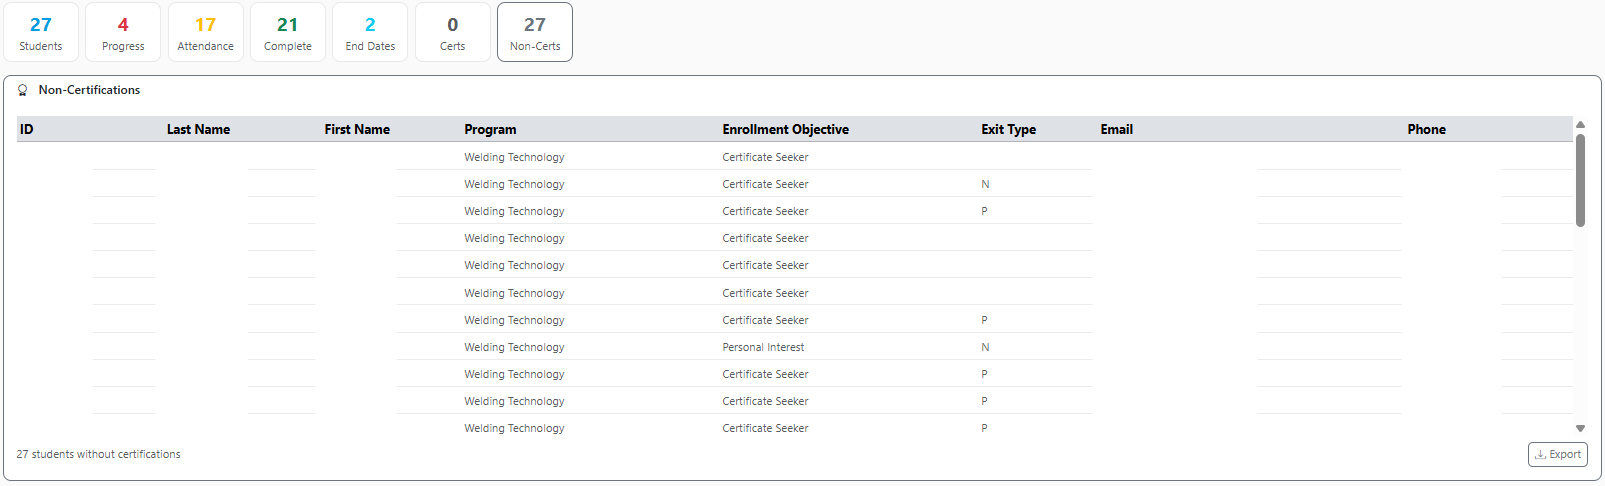
Non-Certifications (Non-Certs)
Identifies students who have not yet achieved certification, supporting follow-up and intervention.
Share Feedback
If you have questions, comments or feature suggestions, please submit them using the following form: https://forms.office.com/r/NreuhQX1Df or send an email to support@northstarmis.org
Your feedback is essential in helping us improve the new Northstar experience. Thank you for your support and participation!